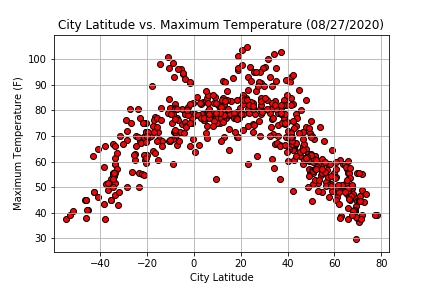
Latitude vs. Maximum Temperature
Analysis
In this visualization, it is clear that the daily maximum temperature rises when approaching the equator. Based on the time of year however, the highest temperatures are clustered around the 20° Latitude mark, as that is the region of the globe that is closest to the sun during the month of August. This visualization would be highly variable based on the time of year in which the data was collected.
Visualizations