Latitude vs. X
Welcome to Latitude!
We are a data visualization team based in Overland Park, Kansas!
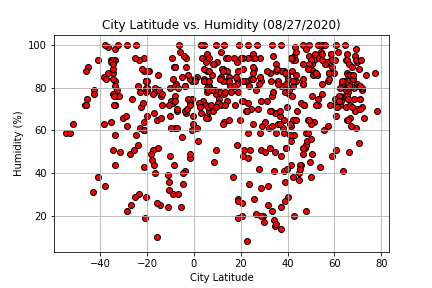
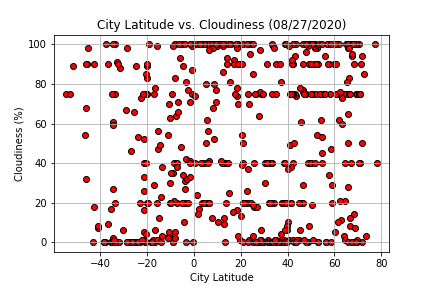
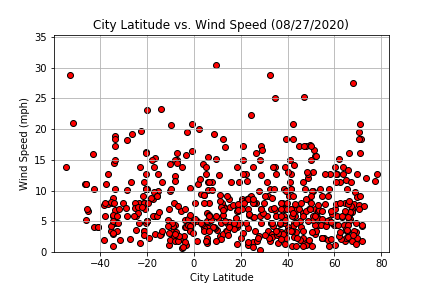
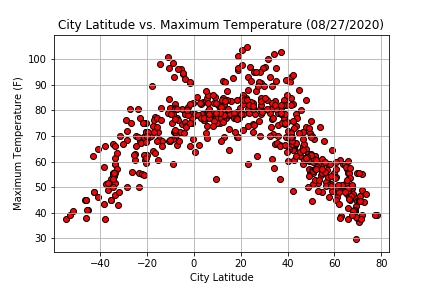
For our inaugural project, we analyzed the effect of latitude on various weather phenomena. In order to complete this analysis, we began by utilizing the CitiPy library to create a random list of over 500 cities from around the world. Next, we used the OpenWeatherMap API to obtain weather reports for each of the cities. Finally, we used the MatPlotLib library to observe latitudinal trends related to each city's weather conditions.
Please take a look around our site! It can be navigated by clicking on the visualizations, or by using the navigation bar present at the top of the page.
If you have any questions or would like to see a more detailed analysis, please see the full WeatherPy project here.
Visualizations